
Have you heard of this trade strategy before?
It’s a strategy that goes against all odds!
It uses an indicator in an entirely different way—and still generates high success rates, or because of this.
This blog post will reveal a special trading strategy. I will uncover all the details so everyone can easily execute this strategy.
Average Directional Index — The Core of the Trade Strategy
Before we dive into the details, we have to understand the most important technical indicator of this crypto trading strategy: the average directional index (ADX).
In general, the ADX is like a particular ingredient in crypto trading strategies.
It helps to boost the quality of almost any trade strategy.
Fundamentally, the indicator measures the trend strength.
By assessing the strength, the ADX helps to filter out “wrong” signals and make a strategy more robust.
Trading Against the ADX – A Proven Strategy
But sometimes, it makes sense to go against the ADX. Going against the ADX means I particularly open trades when a price movement doesn’t show strength (ADX <30).
So here’s a proven trade strategy I use that turns the ADX upside down and delivers robust results. Here’s how it works:
- Search for tokens that have an overbought or oversold RSI value (>70 or <30)
- Additionally, the price should have traded below/above a significant moving average (EMA200, for example) and crossed this line just recently.
- The ADX must be below 30 (the lower, the better!!).
→ If the RSI is overbought, I open a short position; if an oversold RSI is oversold, I open a long position.
So, what’s the idea of this strategy:
I look for pumps not backed by a strong trend (ADX <30). Accordingly, I assume there’s a good chance of a quick reversal and (depending on the chart) continuation of the previous trend.
Chart Example
Here’s a perfect example 👇
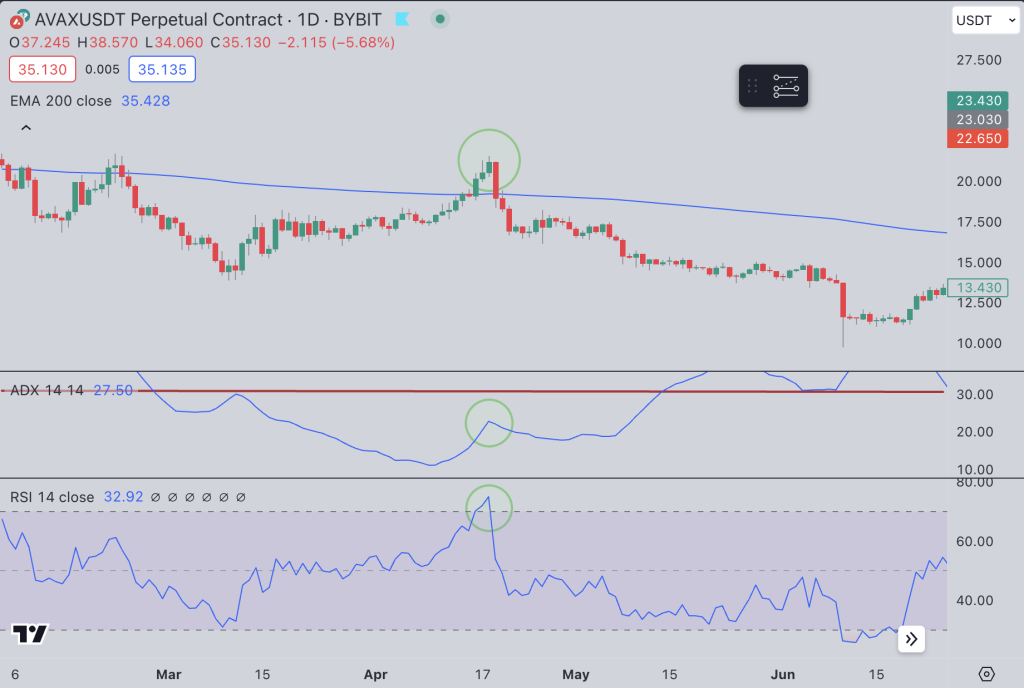
On the daily chart, AVAX enters the overbought territory. Additionally, the price crosses the 200 EMA. At the same time, the ADX remains at 22 (!!).
As a result, we had a reversal immediately.
Depending on the strategy, this trade had a potential of 20%-50%.
If you want to replace emotions with data-driven strategies, you can check out Crypto OS. It’s the platform I developed based on all my mistakes. It contains data-driven trade signals, backtest data, AI forecasts, trading bots, and more.