
After publishing my post about the Average Directional Index (ADX) and how to integrate it into your trading strategy, I received lots of feedback. Many of you asked if there are some more sophisticated crypto trading strategies based on the ADX. Of course, the answer is YES.
That’s why I thought I’d write another post and dive even further into using the ADX. In detail, I want to discuss an ADX-based trading strategy that isn’t very well known. However, it’s super reliable and still easy to use.
So, let’s dive right in and discover another ADX crypto trading strategy.
Advanced ADX + PSAR Trading Strategy — A Perfect Combination
When I discuss the ADX trading strategy, I do not get tired of underpinning that I believe it has an almost perfect combination of indicators. Let me tell you why!
Let’s first take a look at the used indicators. The trading strategy uses three indicators:
- ADX
- Di+ and Di- (both are part of the ADX but provide different information)
- Parabolic Stop and Reverse (PSAR)
All indicators are free on TradingView, so you can easily integrate them into your trading strategy.
ADX Trading Strategy — Explaining The Indicators
So here’s a quick explanation of why these indicators are a perfect match:
Average Directional Index (ADX)
The ADX gives you information about the strength of a trend. Since we only want to trade strong trends, the ADX information is super valuable. Nevertheless, the ADX doesn’t tell you anything about the trend direction.
Di+ / Di-
That’s where Di+ and Di- come in. They provide information about whether we are in a bullish or bearish trend. Perfect, that means we can identify the trend direction and strength based on the ADX. But there’s one more important puzzle piece.
Parabolic Stop And Reverse
The PSAR is a momentum indicator — it provides information about the current momentum (bullish or bearish) and, more importantly, when the momentum changes.
And that’s the perfect combination: The three indicators allow you to derive the overall trend and trend strength and get information about when to enter based on momentum.
Let’s Put It Into Practice
I know that was lots of theory but I think it is important to understand the idea behind a crypto trading strategy. However, now it’s time to go down to business and get practical.
With this example, I will give you a detailed description of a bullish entry and how to use the ADX trading strategy.
In case of a bullish setup, we are looking for the following:
- ADX shows a strong trend: That’s the first and most important information needed to analyze a trade setup. We are looking for the ADX to be 30 or higher. If this isn’t the case, we can go out, relax, spend time with family — or do whatever you want except for trading 🙂
- If the ADX is above 30, we analyze the Di as a next step. Preferably, we have a situation where there’s a massive gap between the Di+ and Di- lines. The more significant the gap, the more precise the direction. We are in a bullish trend if the Di+ line is above the Di- line. Conversely, if the Di- line is above the Di+ line, we are in a bearish trend. However, as mentioned, there should be a clear gap between the lines, signaling a clear trend.
- If you can identify a clear trend based on Di, you must spot the right entry. And that’s where the PSAR comes into play. The PSAR is visualized as small dots across or below the candles. Dots above the candle signal a bearish momentum, and dots below signal a bullish momentum. If the Di lines show a bullish trend, we specifically look for the dots to change from above to below the candles. In other words, we are looking for a change in momentum.
That’s when we are to take a trade. The ADX indicates a strong trend, the Di indicates a clear trend direction, and the PSAR signals a change in momentum.
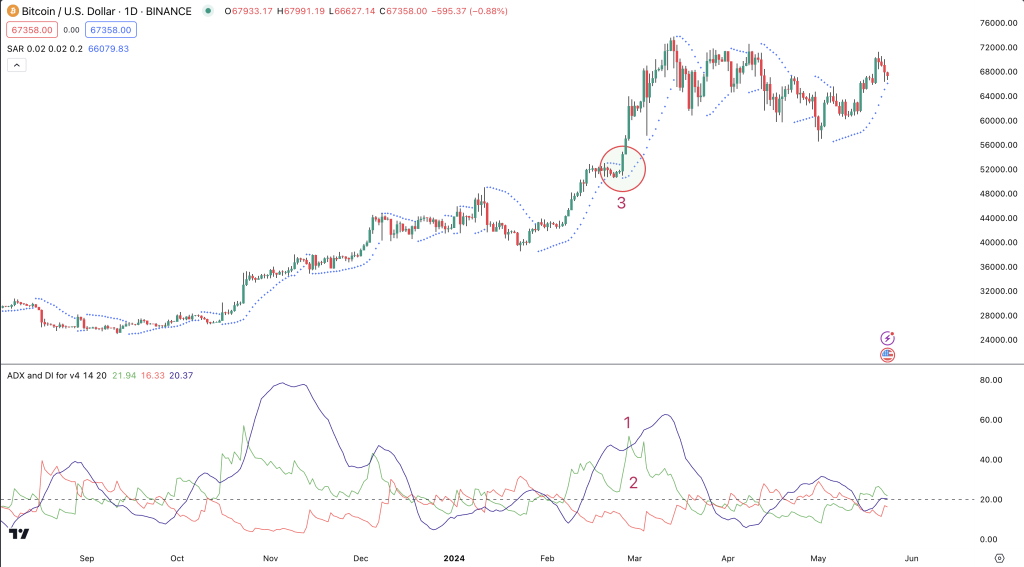
Below is an example from Bitcoin that perfectly illustrates the setup.
- The blue line represents the ADX, which is way above 30 (1)
- The green line represents the Di+, which is above the Di- (red line), and there’s a nice gap between (2)
- The PSAR just flipped from a bearish to a bullish momentum (3)
After the entry signal, Bitcoin has rallied more than 30%!
Short Signals
If you are looking for short signals, the above described approach works too.
- You check for the ADX to be above 30
- You want to have Di- line above the Di+ and a nice gap between both
- You look for the PSAR to change position from below-the-price candles to above
How do you use the ADX?
I would love to hear your feedback. Tell me about your experience using the ADX or let me know about your ADX trading strategies. Simply reach out to me on Twitter or Threads or send me an email.
Want to get started with Crypto Trading?
If you want to get started with crypto trading, you can check out Crypto OS.
It’s the platform I’ve developed based on all the mistakes I made.
It contains data-driven trade signals, backtest data, AI forecasts, trading bots, and so much more. Try it for free!